
DashBoard
This is a widget-take-away widget
<<< Back To Navigation Menu
This is a widget-take-away widget
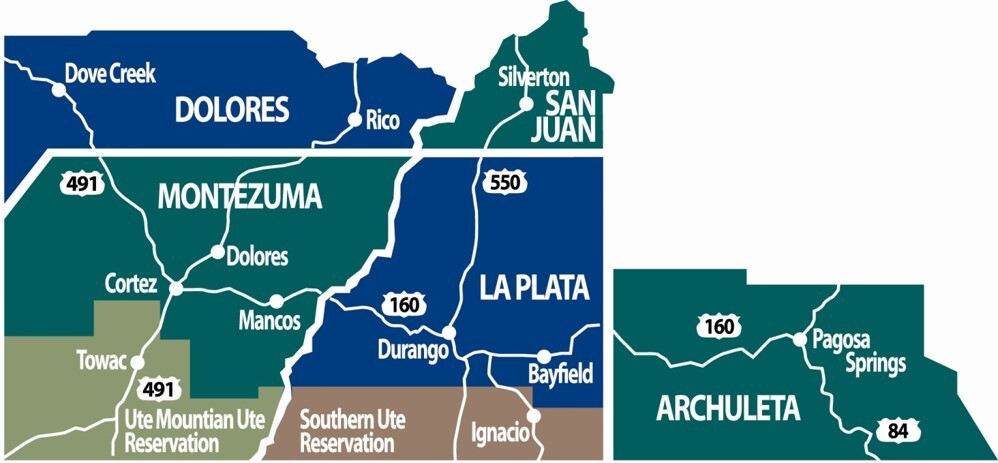
Town of Pagosa Springs, CO
This is a widget-wysiwyg widget
Click here to go back to the main dashboard
This is a widget-take-away widget
Labor Market
This is a widget-take-away widget
Housing
This is a widget-take-away widget
Population
This is a widget-take-away widget
Community
This is a widget-wysiwyg widget
This is a widget-take-away widget
Labor Market
This is a widget-data-table widget
Industry Characteristics
Industry | 2019 Jobs | 2024 Jobs▼ | Change | % Change | Average Earnings |
|---|---|---|---|---|---|
| Accommodation and Food Services | 549 | 716 | 167 | 30.4% | $33,249 |
| Retail Trade | 408 | 562 | 153 | 37.5% | $40,371 |
| Construction | 212 | 297 | 85 | 39.9% | $58,417 |
| Health Care and Social Assistance | 203 | 172 | -31 | -15.2% | $39,276 |
| Real Estate and Rental and Leasing | 141 | 159 | 18 | 12.8% | $47,672 |
| Professional, Scientific, and Technical Services | 75 | 87 | 12 | 15.2% | $58,491 |
| Other Services (except Public Administration) | 90 | 83 | -7 | -8% | $29,146 |
| Administrative and Support and Waste Management and Remediation Services | 84 | 72 | -13 | -15.1% | $37,894 |
| Arts, Entertainment, and Recreation | 104 | 66 | -38 | -36.8% | $17,750 |
| Finance and Insurance | 53 | 61 | 8 | 15% | $81,676 |
MORE
This is a widget-data-table widget
Occupation Characteristics
Occupation | 2019 Jobs | 2024 Jobs▼ | Change | % Change | Median Earnings |
|---|---|---|---|---|---|
| Food Preparation and Serving Related Occupations | 415 | 518 | 103 | 24.7% | $17.09 |
| Sales and Related Occupations | 388 | 482 | 94 | 24.1% | $21.91 |
| Construction and Extraction Occupations | 161 | 209 | 49 | 30.3% | $24.05 |
| Office and Administrative Support Occupations | 181 | 199 | 18 | 10.2% | $21.96 |
| Management Occupations | 114 | 186 | 71 | 62.1% | $33.87 |
| Transportation and Material Moving Occupations | 115 | 149 | 35 | 30.3% | $21.6 |
| Arts, Design, Entertainment, Sports, and Media Occupations | 103 | 124 | 21 | 19.9% | $18.55 |
| Business and Financial Operations Occupations | 73 | 116 | 42 | 57.4% | $33.98 |
| Personal Care and Service Occupations | 126 | 112 | -14 | -11% | $17.85 |
| Building and Grounds Cleaning and Maintenance Occupations | 109 | 93 | -16 | -14.7% | $19.01 |
MORE
This is a widget-data-table widget
Worker Inflow/Outflow
Category | Count |
|---|---|
| Worker Inflow | 2,771 |
| Worker Outflow | 285 |
| Live and Work in Region | 255 |
This is a widget-data-table widget
Method of Commute
Category | Share |
|---|---|
| Drove alone | 55.7% |
| Carpool | 26.7% |
| Public transportation | 2.7% |
| Walked | 5.8% |
| Bicycle | 0.8% |
| Taxicab, motorcycle, or other means | 0% |
| Worked from home | 8.3% |
This is a widget-data-table widget
Job Postings 30-Day Trend
Date | 2025 Postings | 2024 Postings |
|---|---|---|
| Jun 8th | 123 | 43 |
| Jun 9th | 123 | 44 |
| Jun 10th | 128 | 48 |
| Jun 11th | 130 | 50 |
| Jun 12th | 134 | 57 |
| Jun 13th | 138 | 57 |
| Jun 14th | 138 | 57 |
| Jun 15th | 138 | 56 |
| Jun 16th | 138 | 63 |
| Jun 17th | 144 | 68 |
MORE
This is a widget-data-table widget
Job Postings 5-Year Trend
Year | Job Postings |
|---|---|
| Jun 2020 | 53 |
| Jul 2020 | 68 |
| Aug 2020 | 59 |
| Sep 2020 | 72 |
| Oct 2020 | 87 |
| Nov 2020 | 74 |
| Dec 2020 | 76 |
| Jan 2021 | 84 |
| Feb 2021 | 102 |
| Mar 2021 | 135 |
MORE
This is a widget-take-away widget
Housing
This is a widget-data-table widget
Housing Units
Area | Household Population | Persons Per Household | Total Housing Units | Occupied Housing Units | Vacant Housing Units | Vacancy Rate | Household Population to Total Housing Units |
|---|---|---|---|---|---|---|---|
| Pagosa Springs, CO | 1,690 | 2.41 | 1,059 | 702 | 357 | 33.71% | 1.6 |
This is a widget-data-table widget
Median Home Values
Date | Value |
|---|---|
| 2/28/2009 | $234,965 |
| 3/31/2009 | $234,428 |
| 4/30/2009 | $234,417 |
| 5/31/2009 | $234,242 |
| 6/30/2009 | $234,151 |
| 7/31/2009 | $233,458 |
| 8/31/2009 | $232,319 |
| 9/30/2009 | $230,597 |
| 10/31/2009 | $229,147 |
| 11/30/2009 | $227,710 |
MORE
This is a widget-take-away widget
Population
This is a widget-data-table widget
Population Trends
Year | Population |
|---|---|
| 1980 | 1,331 |
| 1981 | 1,477 |
| 1982 | 1,562 |
| 1983 | 1,389 |
| 1984 | 1,328 |
| 1985 | 1,311 |
| 1986 | 1,299 |
| 1987 | 1,240 |
| 1988 | 1,164 |
| 1989 | 1,184 |
MORE
This is a widget-data-table widget
Population by Age Group
Category | Share |
|---|---|
| Under 5 years | 6.05% |
| 5 to 9 years | 10.54% |
| 10 to 14 years | 3.55% |
| 15 to 19 years | 10.42% |
| 20 to 24 years | 5.65% |
| 25 to 29 years | 5.41% |
| 30 to 34 years | 9.6% |
| 35 to 39 years | 6.87% |
| 40 to 44 years | 4.54% |
| 45 to 49 years | 4.89% |
| 50 to 54 years | 2.15% |
| 55 to 59 years | 7.16% |
| 60 to 64 years | 6.05% |
| 65 to 69 years | 6.75% |
| 70 to 74 years | 3.55% |
| 75 to 79 years | 2.97% |
| 80 to 84 years | 2.85% |
| 85 years and over | 0.99% |
This is a widget-data-table widget
Population by Sex
Category | Count |
|---|---|
| Male | 776 |
| Female | 942 |
This is a widget-take-away widget
Community
This is a widget-take-away widget
Click here to visit the Region 9 Commercial Real Estate Dashboard
Search Commercial Real Estate Listings
This is a widget-wysiwyg widget
Commercial Real Estate Dashboard
This interactive dashboard allows users to easily search and explore commercial real estate listings using a range of customizable filters. Viewers can search properties by price range, square footage, acreage, address, keywords, and more. Designed for efficiency and clarity, the dashboard provides dynamic results and real-time updates, helping investors, brokers, and business owners quickly find properties that meet their specific criteria. Link to Commercial Real Estate
This is a widget-data-table widget
Livable Wage Monthly Costs
Monthly Costs | Adult | Adult + Preschooler | 2 Adults + Preschooler + School-age |
|---|---|---|---|
| Housing (2) | $ 1,750.00 | $ 2,000.00 | $ 2,000.00 |
| Childcare (3) | 0 | $ 1,280.00 | $ 1,694.00 |
| Utilities (4) | $ 270.00 | $ 270.00 | $ 270.00 |
| Food | $ 409.00 | $ 603.00 | $ 1,191.00 |
| Transportation | $ 396.00 | $ 406.00 | $ 779.00 |
| Health Care Costs | $ 281.00 | $ 883.00 | $ 1,041.00 |
| Miscellaneous | $ 318.00 | $ 547.00 | $ 757.00 |
| Taxes | $ 517.00 | $ 1,108.00 | $ 1,528.00 |
| Earned Income Tax Credit (-) | 0 | 0 | 0 |
| Childcare Tax Credit (-) | 0 | $ (50.00) | $ (100.00) |
| Child Tax Credit (-) | 0 | $ (167.00) | $ (333.00) |
This is a widget-data-table widget
Livable Wage Study Self Sufficiency Wage
Monthly Costs | Adult | Adult + Preschooler | 2 Adults + Preschooler + School-age |
|---|---|---|---|
| Hourly Wage for each working adult (5) | $ 22.39 | $ 39.09 | $ 25.08 |
| # of jobs at minimum wage ($14.42) | 1.55 | 2.71 | 1.74 |
| Monthly Costs | $ 3,941.00 | $ 6,879.00 | $ 8,827.00 |
| Annual | $ 47,296.00 | $ 82,552.00 | $ 105,919.00 |
| Emergency Savings (6) | $ 70.00 | $ 183.00 | $ 108.00 |
This is a widget-data-table widget
2023 ALICE Data
Category | Percentage |
|---|---|
| % Poverty | 19.9% |
| % ALICE | 45.4% |
| % Above | 34.6% |
This is a widget-take-away widget
Back to Top