
DashBoard
Visit This Dashboard for text accessible dashboard
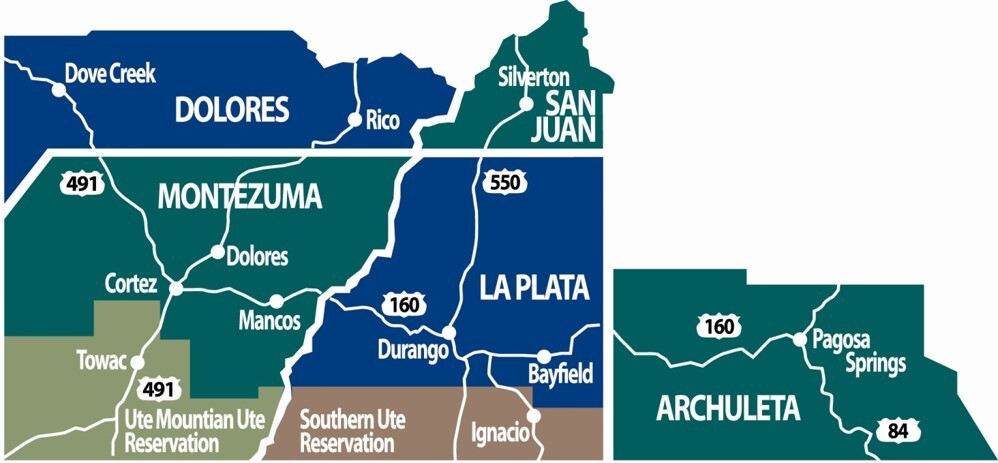
Curious about our county's economy and demographics? Dive into our interactive dashboard to explore key indicators and regional trends.
Industry Sector Characteristics
Industry | 2024 Jobs | 2024 Average Earnings Per Worker | 2024 LQ (Industry Concentration) | 2019-2024 % Change in Jobs | 2024 GRP |
|---|---|---|---|---|---|
| Construction | 1,494 | $58,796 | 2.65 | 32.47% | 114M |
| Accommodation and Food Services | 1,236 | $32,527 | 1.76 | 26.52% | 70.9M |
| Real Estate and Rental and Leasing | 1,161 | $50,233 | 1.98 | 47.43% | 82M |
| Retail Trade | 1,074 | $39,824 | 1.2 | 10.15% | 78.9M |
| Government | 975 | $81,160 | 0.85 | 3.23% | 91.31M |
| Other Services (except Public Administration) | 631 | $36,376 | 1.13 | -3.83% | 25.34M |
| Health Care and Social Assistance | 593 | $43,810 | 0.51 | 2.27% | 29M |
| Agriculture, Forestry, Fishing and Hunting | 522 | $25,408 | 3.14 | 1.68% | 23.41M |
| Professional, Scientific, and Technical Services | 516 | $56,172 | 0.69 | 10.05% | 34.57M |
| Finance and Insurance | 404 | $55,412 | 0.64 | 49.48% | 31.82M |
Source: Lightcast
Occupation Characteristics
Profession | 2024 Jobs | 2024 Median Salary | 2024 Average Hourly Wage | 2024 LQ (Occupation Concentration) | 2019-2024 % Change in Jobs |
|---|---|---|---|---|---|
| Sales and Related | 1,565 | $45,021 | $40.7 | 1.34 | 20.74% |
| Management | 1,407 | $52,349 | $39.82 | 1.49 | 33.63% |
| Construction and Extraction | 1,051 | $49,064 | $29.32 | 2.41 | 19.42% |
| Food Preparation and Serving Related | 839 | $35,139 | $19.69 | 1.28 | 17.97% |
| Office and Administrative Support | 755 | $44,862 | $24.21 | 0.73 | 13.4% |
| Business and Financial Operations | 681 | $69,739 | $48.46 | 0.84 | 55.13% |
| Building and Grounds Cleaning and Maintenance | 454 | $39,705 | $23.43 | 1.33 | 3.53% |
| Transportation and Material Moving | 432 | $42,940 | $24.97 | 0.53 | 9.41% |
| Personal Care and Service | 399 | $36,904 | $24.57 | 1.16 | -0.35% |
| Arts, Design, Entertainment, Sports, and Media | 358 | $38,696 | $30.2 | 1.14 | 20.54% |
Source: Lightcast
Job to Job Flow by State
Which states are workers coming from?
Source: US Census Bureau
Job to Job Flow by Industry
What are the industries workers are going into when coming into the state?
Source: US Census Bureau
Workforce Jobs, Resident Workers, and Net Commuters
Source: Lightcast
Worker Inflow/Outflow
Source: OnTheMap
Method of Commute
Source: American Community Indicators
Distance to Workplaces
How far employees are from their place of work
Category | Count | Share |
|---|---|---|
| Less than 10 miles | 2,843 | 60.7% |
| 10 to 24 miles | 344 | 7.3% |
| 25 to 50 miles | 412 | 8.8% |
| Greater than 50 miles | 1,086 | 23.2% |
Source: OnTheMap
Direction to Workplaces
The direction employees drive to workplace
646
364
702
1509
381
546
205
332
Destination Analysis
Places residents work
Place | Count | Share |
|---|---|---|
| Pagosa Springs town, CO | 348 | 7.4% |
| Durango city, CO | 79 | 1.7% |
| Colorado Springs city, CO | 54 | 1.2% |
| Arboles CDP, CO | 43 | 0.9% |
| Alamosa city, CO | 34 | 0.7% |
| Del Norte town, CO | 34 | 0.7% |
| Aurora city, CO | 28 | 0.6% |
| Farmington city, NM | 28 | 0.6% |
| Cortez city, CO | 26 | 0.6% |
| Denver city, CO | 26 | 0.6% |
| All Other Locations | 3,985 | 85.1% |
Source: OnTheMap
Place of Work
Where residents jobs are located
Source: ACS 5-year Survey
Unemployment and Labor Force Participation Rates
Source: Lightcast
Job Postings 30-Day Trend
Source: Lightcast
Job Postings 5-Year Trend
Source: Lightcast
Housing Units
Area | Household Population | Persons Per Household | Total Housing Units | Occupied Housing Units | Vacant Housing Units | Vacancy Rate | Household Population to Total Housing Units |
|---|---|---|---|---|---|---|---|
| Archuleta, CO | 14,086 | 2.3 | 10,025 | 6,133 | 3,892 | 38.8% | 1.41 |
Source: Colorado State Demography Office
Median Home Values
Source: Zillow Home Value Index
Population Trends
Source: Colorado State Demography Office
Population by Age
Source: Colorado State Demography Office
Population by Sex
Source: Colorado State Demography Office
Population by Race/Ethnicity
Source: Colorado State Demography Office
Commercial Real Estate Dashboard
This interactive dashboard allows users to easily search and explore commercial real estate listings using a range of customizable filters. Viewers can search properties by price range, square footage, acreage, address, keywords, and more. Designed for efficiency and clarity, the dashboard provides dynamic results and real-time updates, helping investors, brokers, and business owners quickly find properties that meet their specific criteria. Link to Commercial Real Estate
Understanding Livable Wage and ALICE Household Budgets:
When assessing community well-being, it's important to differentiate between ALICE (Asset Limited, Income Constrained, Employed) Household Budgets and Livable Wage Budgets.
ALICE budgets detail the bare minimum cost of living for working households, revealing the large segment earning above poverty but still struggling to afford essentials. Livable Wage budgets define the income needed for self-sufficiency and a basic standard of living without public aid.
Understanding both is crucial for our communities because:
-ALICE data exposes the hidden financial struggles of our workforce, informing targeted support and development.
-Livable Wage data provides aspirational benchmarks for fair compensation, guiding businesses and economic growth.
Together, these insights can help us to build a more resilient workforce, foster sustainable economic development, and secure funding for initiatives that truly address our community's needs.
Livable Wage Monthly Costs
Monthly Costs | Adult | Adult + Preschooler | 2 Adults + Preschooler + School-age |
|---|---|---|---|
| Housing (2) | $ 1,750.00 | $ 2,000.00 | $ 2,000.00 |
| Childcare (3) | 0 | $ 1,280.00 | $ 1,694.00 |
| Utilities (4) | $ 270.00 | $ 270.00 | $ 270.00 |
| Food | $ 409.00 | $ 603.00 | $ 1,191.00 |
| Transportation | $ 396.00 | $ 406.00 | $ 779.00 |
| Health Care Costs | $ 281.00 | $ 883.00 | $ 1,041.00 |
| Miscellaneous | $ 318.00 | $ 547.00 | $ 757.00 |
| Taxes | $ 517.00 | $ 1,108.00 | $ 1,528.00 |
| Earned Income Tax Credit (-) | 0 | 0 | 0 |
| Childcare Tax Credit (-) | 0 | $ (50.00) | $ (100.00) |
| Child Tax Credit (-) | 0 | $ (167.00) | $ (333.00) |
Source: Region 9 Livable Wage Study
Livable Wage Study Self Sufficiency Wage
Monthly Costs | Adult | Adult + Preschooler | 2 Adults + Preschooler + School-age |
|---|---|---|---|
| Hourly Wage for each working adult (5) | $ 22.39 | $ 39.09 | $ 25.08 |
| # of jobs at minimum wage ($14.42) | 1.55 | 2.71 | 1.74 |
| Monthly Costs | $ 3,941.00 | $ 6,879.00 | $ 8,827.00 |
| Annual | $ 47,296.00 | $ 82,552.00 | $ 105,919.00 |
| Emergency Savings (6) | $ 70.00 | $ 183.00 | $ 108.00 |
Source: Region 9 Livable Wage Study
% ALICE Households
Source: United for ALICE
2023 ALICE Data
Category | Percentage |
|---|---|
| % Poverty | 8% |
| % ALICE | 32% |
| % Above | 60% |
Source: United for ALICE